The Union of Communication and Data Science

Just like the theory of the tapper and the receiver wherein a person tapping his table hears a different rhythm than the other person who hears a different rhythm. To experts, all these fancy statistics and mathematical jargons are intuitive and straightforward but to people across the room, and of different backgrounds, the case may be different. To address this, data visualization hopes to bridge the gap between by providing dynamic, interactive, and straightforwardsolutions to enable collaboration across industries.
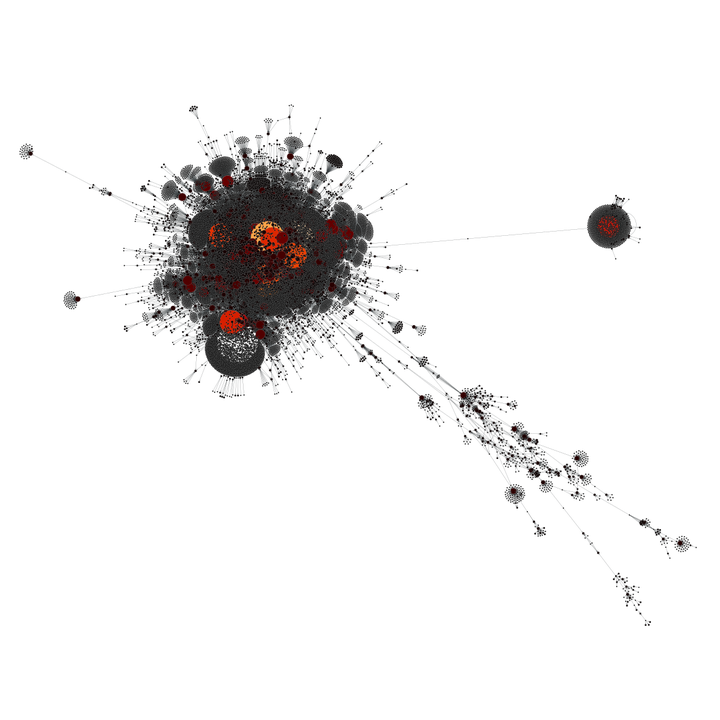
It is easy to conclude that colorful and playful graphics are enough to convey the message of a data analysis. However, it is more than that –in fact,the aesthetic appeal of the visualization is merely at the surface. Instead, a data scientist must focus on the compression and intuition that the visualization would give. A good visualization must be compressed –it must be able to convey multiple information and various analysis with just a single figure. Also, it must be intuitive and straightforward. Although complex visualizations seem interesting and smart, it is nothing but egoistic for a researcher to adhere to this without considering the audience. Ergo, in order to effectively communicate your data, you must come up with a visualization that compresses multiple ideas into one but also is straightforward enough to be able to appeal and communicate directly to audiences of different backgrounds.
Building on the idea of people coming from various backgrounds, it has been established that the industries around us today works in a dynamic and interdisciplinary way. One must be able to appeal and communicate to a wide variety of audiences across the different markets and industries. This is where the union of communication and data analysis is emphasized. Data visualization is instrumental to comprehensively communicate research analysis and results but for this to translate into concrete actions, it must be understood by the different stakeholders at hand.
Data Visualization is the union of communication and data science.
This essay was a requirement under the DVS class and has been published with permission from the author, one of my MSDS students. - Prof. E