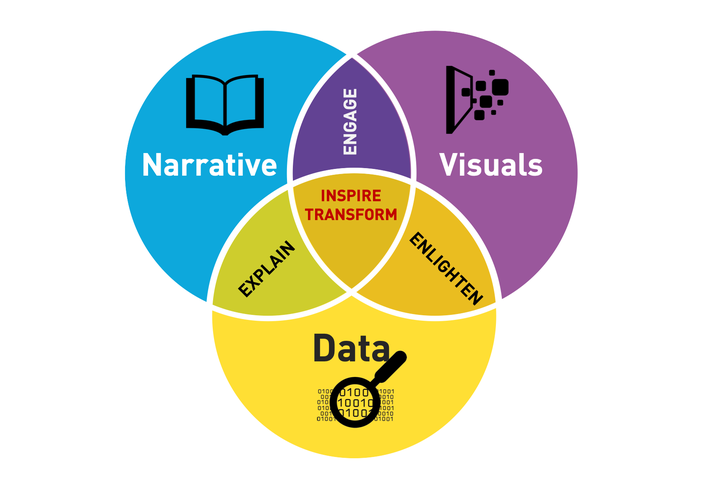
DVS: A Toolkit

Coming from a background that put a premium on the backend of studies, I never gave visualization much of a thought. To me, the idea of crafting a story of my work was a frivolity I could not afford. This course in Data Visualization and Storytelling has placed these concepts onto the center stage. It has made me shed off the idea that the more jargon-y and complex-looking your work is, the more important it is. What DVS has shown me is that good analytic work is useless if it is not translated into action, which is facilitated through clear and concise communication.
Our exercises with applying traditional statistical methods on tricky data sets really stuck with me. If I were alone and did not know any better, I would have committed the exact mistakes that the course has taught me to avoid. Before this course, all I had was a hammer and everything looked like a nail. All in all, I would sum up this course as a tool kit. It has given me more than enough to work with such that now when I am exploring new data, I can be present them more confidently.
This essay was a requirement under the DVS class and has been published with permission from the author, one of my MSDS students. - Prof. E